In today’s interconnected agricultural and industrial economy, few commodities influence global food security and industrial production as directly as urea. With a nitrogen content of ≥46%, urea (CO(NH₂)₂) is the backbone of nitrogen fertilizers worldwide and a key raw material for resins, pharmaceuticals, explosives, dyes, and specialty chemicals.
Over the past five years, the international price of urea has moved from relative stability to historic highs and then into a new phase of recalibration. For fertilizer importers, agricultural distributors, mining companies, and government procurement agencies, understanding these fluctuations is not optional — it is a strategic necessity.
This article explores:
The historical evolution of the international price of urea
The real economic forces driving volatility
Regional price comparisons and forecasts
Actionable procurement strategies
A recommended large-scale supplier with proven international capability
Let’s examine why the international price of urea has become one of the most closely watched indicators in the global fertilizer market.
A Market That Moves with Energy: The Real Driver Behind Urea Prices
Urea is produced from ammonia, which is synthesized primarily using natural gas. This means the international price of urea is fundamentally tied to global energy markets.
When gas prices rise, fertilizer costs rise. When gas supplies are disrupted, fertilizer plants shut down. And when supply shrinks, prices surge.
The Energy Shock That Changed Everything
Between 2021 and 2022, natural gas prices in Europe more than doubled. Fertilizer production costs soared, forcing many European plants to suspend operations. The result? A dramatic spike in the international price of urea.
Natural Gas vs. International Price of Urea
| Year | Avg. Natural Gas Price (USD/MMBtu) | Avg. Urea Price (USD/MT) |
|---|---|---|
| 2021 | 6.5 | 480 |
| 2022 | 12.0 | 820 |
| 2023 | 5.8 | 420 |
The data clearly demonstrates a strong positive correlation between energy costs and the international price of urea.
A Look Back: How the International Price of Urea Evolved
Understanding historical pricing patterns provides valuable insight into future trends.
Average International Price of Urea
| Year | Avg. Price (USD/MT) | Market Condition |
|---|---|---|
| 2018 | 260 | Stable demand |
| 2019 | 245 | Slight oversupply |
| 2020 | 270 | Pandemic disruption |
| 2021 | 480 | Energy inflation |
| 2022 | 820 | Supply crisis |
| 2023 | 420 | Correction phase |
| 2024 | 360–420 | Stabilizing |
The international price of urea reached record highs in 2022, nearly tripling compared to pre-pandemic levels. Since then, improved logistics and stabilized gas prices have brought the market into a more balanced state.
However, volatility remains an inherent characteristic of this sector.
For more information on urea pricing, please see this article: Price of Urea Per Ton
Global Production: Who Controls Supply?
Global urea production exceeds 200 million metric tons annually, but production capacity is not evenly distributed.
Global Urea Production by Region
| Region | Production (Million Tons) | Share (%) |
|---|---|---|
| China | 55 | 27% |
| South Asia | 35 | 17% |
| Middle East | 30 | 15% |
| Europe | 25 | 12% |
| North America | 20 | 10% |
| Others | 40 | 19% |
| Total | 205 | 100% |
China remains the world’s largest producer, giving Asian exporters strong influence over the international price of urea.
Export restrictions in major producing countries can quickly tighten supply and push prices upward.
Regional Price Comparison: Where Is Urea Most Competitive?
Even when global prices move together, regional differences remain.
International Urea Price by Export Hub
| Export Hub | FOB Price (USD/MT) | Competitive Advantage |
|---|---|---|
| China | 350–380 | Scale, cost efficiency |
| Middle East | 370–400 | Low gas cost |
| Russia | 360–390 | Large reserves |
| US Gulf | 400–430 | Domestic demand strength |
China’s cost advantage often positions it as one of the most competitive sources in the global market.
Demand Pressure: Feeding a Growing World
The international price of urea is not only about energy — it is also about food.
Global population growth and increasing grain demand continue to support nitrogen fertilizer consumption. Urea accounts for over half of total nitrogen fertilizer use worldwide.
Annual demand growth is estimated at 1.5–2%, driven by:
Expanding agricultural acreage
Crop yield optimization
Government fertilizer subsidies
Food security policies
Seasonal planting cycles also create short-term demand spikes that influence the international price of urea.
For more information on the applications of urea in agriculture, please refer to this article: The Application of Urea Fertilizer for Apple Trees
Forecast: Where Is the International Price of Urea Headed?
Looking ahead to 2025–2027, most analysts expect moderate stabilization, though fluctuations will remain linked to energy markets and geopolitics.
Forecast of International Urea Prices
| Year | Expected Range (USD/MT) | Market Outlook |
|---|---|---|
| 2026 | 370–480 | Demand-driven growth |
| 2027 | 380–500 | Gradual upward trend |
While extreme spikes like 2022 may be less likely, the international price of urea will continue responding to global economic shifts.
Strategic sourcing is therefore essential.
Choosing the Right Supplier in a Volatile Market
In a market defined by volatility, stability becomes the ultimate competitive advantage.
Buyers should prioritize suppliers with:
Large-scale production capacity
Advanced international technology
Export compliance credentials
Diversified product portfolio
Proven global trade experience
One company that meets these criteria is San Corporation.
San Corporation: A Reliable Partner in the Global Fertilizer Market
Founded in 2002, San Corporation has established itself as:
The largest ammonium nitrate exporting enterprise in China
One of the few enterprises approved by the National Defense Department for exporting dangerous goods
Home to China’s largest ammonium nitrate production base
Strong Production Capacity
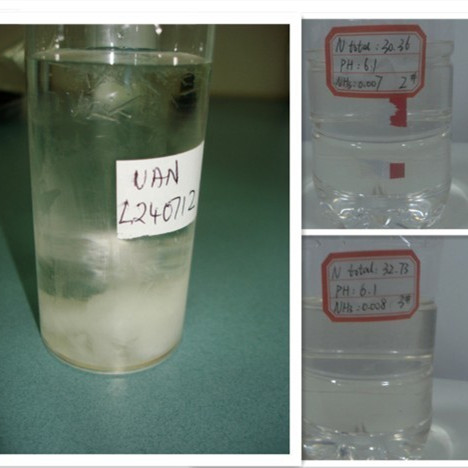
Annual ammonium nitrate production: 1.2 million tons
Urea Ammonium Nitrate (UAN) capacity: 300,000–400,000 tons annually
Export volume (as of 2012): 80,000 tons
The company operates a large-scale manufacturing complex with:
Advanced production lines
Dedicated research center
Patented technologies from Germany, Japan, France, Norway, and other countries
Its strategic philosophy — “Technology builds enterprises, steady operation prospers them” — ensures sustainable development and consistent product quality.
Urea Product Specifications
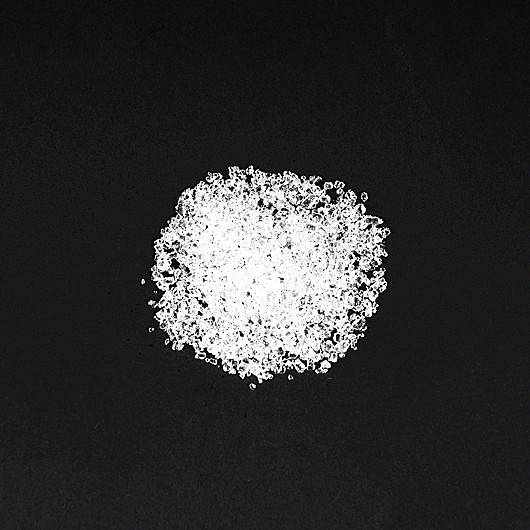
Nitrogen Content: ≥46%
Free Water: ≤0.5%
Biuret: ≤1.0%
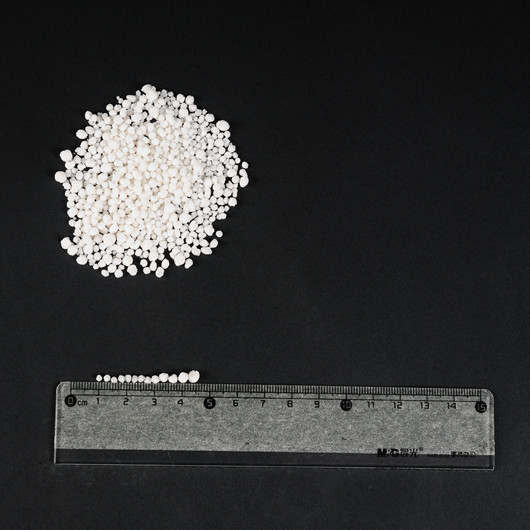
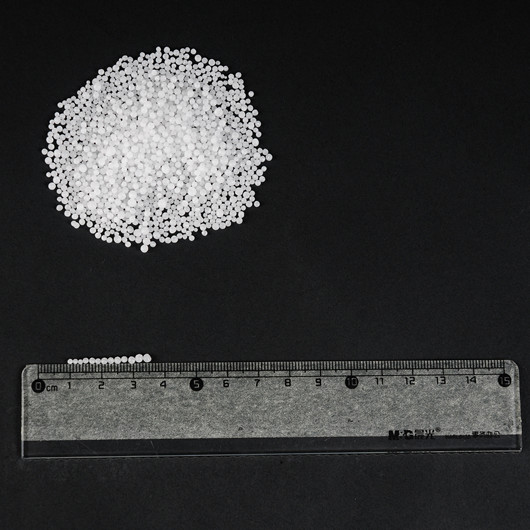
Particle Size (2.0–4.75mm): ≥90%
Appearance: White or slightly reddish solid granules
Packaging: 50kg PP/PE bags or customized
High-quality urea ensures:
Efficient nitrogen release
Reduced caking during storage
Stable industrial processing
Safe transportation
Price alone does not determine purchasing decisions. Quality consistency directly impacts agricultural productivity and industrial safety. For bulk buyers, reliable quality can significantly reduce downstream operational risks.
View their products: Urea
Competitive Product Advantages
San Corporation supplies:
Urea
Porous Prilled Ammonium Nitrate (PPAN)
Calcium Ammonium Nitrate
Calcium Nitrate
Urea Ammonium Nitrate Solution
Urea Advantages
Nitrogen ≥46%
Strict moisture control
Stable granulation
Competitive export pricing
Bulk supply capability
The company focuses on large-scale buyers, including:
Global distributors
Government procurement agencies
Military buyers
Large mining enterprises
Due to large production capacity and complex logistics, small-volume orders are not accepted — ensuring efficiency and stability in bulk shipments.
Conclusion: Turning Market Volatility into Opportunity
The international price of urea has evolved from a stable agricultural indicator into a strategic global commodity benchmark influenced by energy markets, geopolitics, and food security.
For buyers navigating this complex environment, the key is not merely tracking prices — but partnering with reliable, technologically advanced, and large-scale suppliers capable of delivering consistent quality at competitive cost.
San Corporation, with its strong manufacturing base, advanced technology integration, and extensive export experience, represents a strategic choice for international buyers seeking stability in an inherently volatile market.
In a world where fertilizer prices can shift rapidly, choosing the right supplier may be the most important investment decision you make. Contact San Corporation to order urea.